How to Compare Commercial Recycling Rates Across Providers Without Surprises
How to Compare Commercial Recycling Rates Across Providers Without Surprises
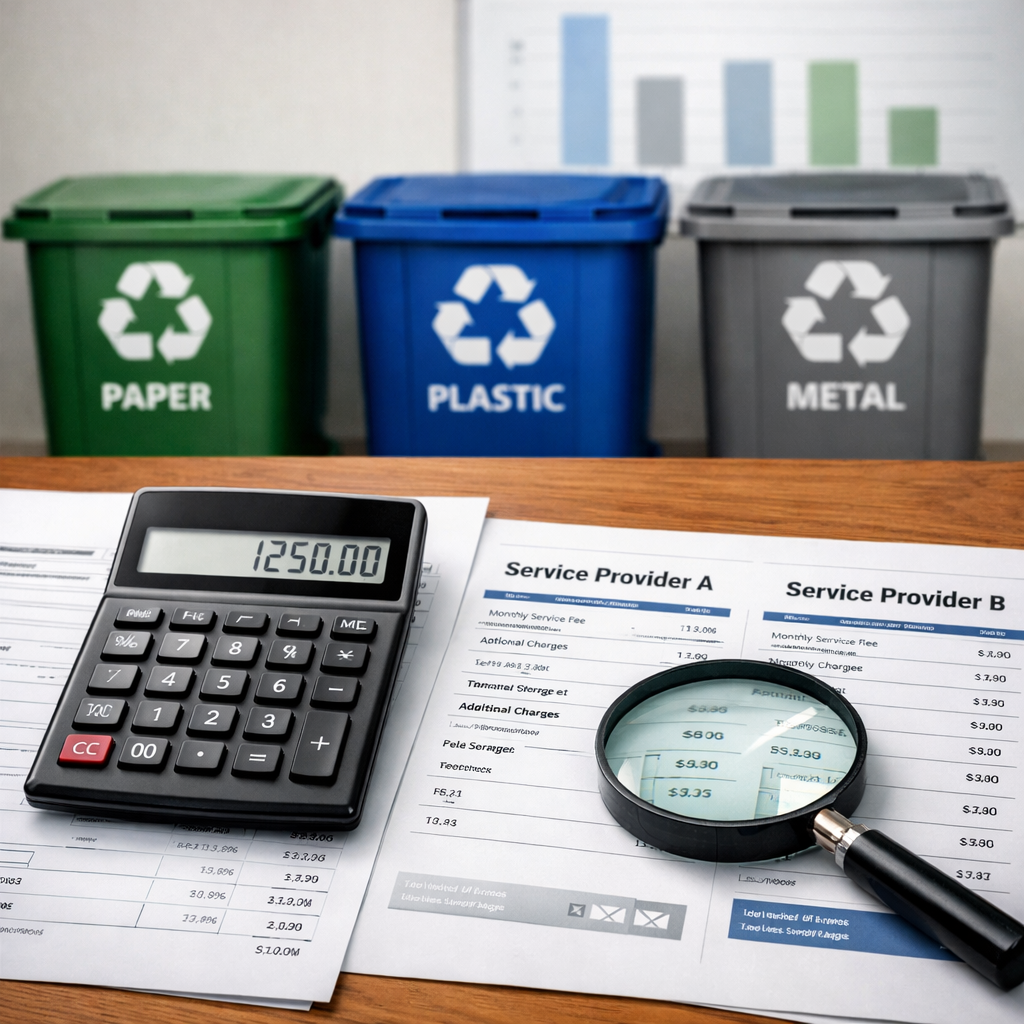
Choosing a recycling provider shouldn’t be a guessing game. To compare commercial recycling rates across providers without surprises, lock in consistent definitions, a shared 12‑month reporting window, and verifiable evidence from weighbridges and materials recovery facilities (MRFs). Use a compact KPI set—recycling rate, diversion, processing yield, contamination, cost per ton, CO2 savings, and destination transparency—and normalize by material and facility intensity so you see true performance, not marketing claims. Keep policy context in view: the U.S. recycling rate sits near 32%, with a national goal of 50% by 2030 and methodology updates underway, which puts a premium on defensible data and audit trails (see EPA National Recycling Goal). This Recycler Routing Guide playbook shows exactly how to structure scope, request data, verify claims, and run pilots—plus the practical operations moves that eliminate overage fees and missed collections.
Define scope and a 12-month reporting window
Begin by defining exactly what you’re comparing so results reflect operations instead of seasonal noise. List included facilities, material streams (paper, metals, glass, plastics, organics), and service types (single‑stream vs. source‑separated). Specify collection methods and downstream processes (on‑site baling, compaction, transfer).
Use a single 12‑month window for all providers. Annualizing aligns reporting cycles, dampens seasonal distortion, and prevents selective “best month” snapshots.
Note for executives: the U.S. recycling rate is roughly 32% and the goal is 50% by 2030, with ongoing methodology improvements—anchoring your horizon to this context helps align targets and disclosures with policy signals (see EPA National Recycling Goal).
Standardize the recycling rate formula and included materials
Use one formula across all providers: recycling rate = (total recycled materials ÷ total waste generated) × 100. For example, if a site generates 1,000 tons of waste and 400 tons are recycled, the recycling rate is 40%. Recycler Routing Guide applies this same formula across provider benchmarks. Use a single 12‑month window and document which materials you count to avoid apples‑to‑oranges results (see industry guidance on recycling success).
Define your scope up front. Common included materials: OCC and mixed paper, metals, glass, PET/HDPE plastics, and organics. Exclude rubble, hazardous waste, or construction debris unless analyzed separately.
Clarify related metrics. Diversion rate measures the share of total waste kept from landfills via recycling or reuse. It’s broader than the recycling rate if it includes reuse, donation, or energy recovery—so state what’s in or out.
Request provider methodologies and counting rules
Ask providers to document how they count “recycled.” Specify whether they count only mechanical recycling, include energy recovery, or treat exports as recycling. Require clarity on how contamination is measured and deducted, and whether downstream confirmations (buyer receipts or mill takedowns) are obtained.
Why it matters: cross‑country and cross‑program data inconsistencies are common; gaps between what’s collected and what is truly recycled can be significant (e.g., PET bottle recycling running ~17% below collection and metal containers ~8% below in EU analyses), making method transparency essential (see Reloop’s Global Recycling League Table).
Collect raw data and evidence for each material stream
Request raw, auditable data instead of headline percentages:
- Tonnage by material stream and by month
- MRF processing yield and contamination rates by material and facility
- Destination evidence: weighbridge tickets, MRF output reports, buyer receipts/sales records
Make digital traceability the norm—Recycler Routing Guide standard. Timestamped weighbridge manifests and MRF reports double as proof‑of‑service and audit checkpoints.
Expect variation by material. Only about 21% of potentially recyclable material is captured across the U.S. system, with most losses occurring upstream—so inspect capture and yield by material and location to see where improvements are feasible (see The Recycling Partnership’s 2024 State of Recycling).
Normalize units, exclusions, and facility-intensity metrics
Convert all volumes to short tons and align assumptions (moisture, contamination deductions). Document exclusions like one‑off cleanouts or project waste so comparisons remain fair.
Create intensity metrics to compare unlike facilities:
- Recycled tons per 1,000 sq ft
- Recycled tons per occupant or production unit
- Recycled tons per $1M revenue
Use a Recycler Routing Guide normalization template to structure like‑for‑like comparisons:
| Provider | Material | Tons Collected | MRF Yield % | Recycled Tons (Post‑Yield) | Contamination % | Destination (Domestic/Export) |
|---|---|---|---|---|---|---|
| [Fill] | OCC | [Fill] | [Fill] | [Calc] | [Fill] | [Fill] |
| [Fill] | PET | [Fill] | [Fill] | [Calc] | [Fill] | [Fill] |
Verify data quality with audits and digital traceability
Build confidence through verification aligned with Recycler Routing Guide practices. Require third‑party audits or periodic spot checks and use digital chain‑of‑custody (weighbridge/MRF timestamps, manifests) for key loads.
Favor providers aligning with emerging best practices as national methodologies evolve, which will tighten definitions and reporting expectations (see EPA National Recycling Goal).
Triangulate with public datasets to confirm local acceptance lists and performance patterns for your markets (see The Recycling Partnership’s open data resources).
Compare KPIs that drive cost and compliance
Use a compact KPI set—used by Recycler Routing Guide—that maps to cost, quality, and regulatory outcomes. Weight KPIs by your priorities (cost vs. compliance vs. quality):
- Recycling rate (overall and by material)
- Material capture rate (recovered ÷ generated)
- Processing yield (saleable output ÷ collected)
- Contamination rate (non‑recyclables in stream)
- Cost per ton (recycling vs. landfill/incineration) and net cost after commodity revenue
- CO2e savings per ton recycled
- Destination transparency (domestic vs. export; buyer confirmations)
Anchor expectations. Industry guidance often cites 30%–50% as a common facility range, while high performers exceed 50% (see industry guidance on recycling success). Treat materials separately: U.S. plastics recycling rates are about 5%–6% while paper is closer to ~66%—plan material‑specific targets accordingly (see Beyond Plastics analysis and industry guidance on recycling success).
Recycling rate and capture by material
Compare capture and recycling rates for OCC, mixed paper, metals, glass, PET/HDPE, and organics to pinpoint strengths and gaps. Policy matters: several countries achieve 90%+ glass collection with deposit return schemes, showing how DRS can shift outcomes materially (see Reloop’s Global Recycling League Table).
Watch the difference between collection and true recycling. EU studies show PET recycling can trail collection by ~17% and metals by ~8% due to sorting and quality losses—post‑MRF yield is where truth lives (see Reloop’s Global Recycling League Table).
Per‑material view (fill with your data):
| Material | Collected Tons | MRF Yield % | Recycled Tons (Post‑Yield) | Capture vs. Generation % |
|---|---|---|---|---|
| OCC | [Fill] | [Fill] | [Calc] | [Fill] |
| PET | [Fill] | [Fill] | [Calc] | [Fill] |
| Glass | [Fill] | [Fill] | [Calc] | [Fill] |
| Organics | [Fill] | [Fill] | [Calc] | [Fill] |
Processing yield and contamination
Processing yield is the percentage of collected material that becomes saleable recycled output after sorting and contamination removal. Track yield and contamination by material and by MRF.
Require providers to show how contamination is deducted from recycling claims. Upstream quality matters: the Recycling Partnership reports that 76% of recyclables are lost at the household level, underscoring the payoff of accurate acceptance lists and on‑site education (see The Recycling Partnership’s 2024 State of Recycling).
Cost per ton and greenhouse gas savings
Compare like‑for‑like financials and environmental benefits:
- Itemize cost/ton for recycling vs. landfill/incineration, including transport, processing, and fees
- Net cost after commodity revenue (e.g., OCC bales)
- Estimated CO2e savings per ton recycled by material
Context: manufacturing recycled plastic can use roughly 88% less energy than producing virgin plastic, illustrating the carbon benefits of higher capture and quality (see business waste statistics overview).
Cost and carbon view (fill with your data):
| Material | Recycle Cost/Ton ($) | Landfill Cost/Ton ($) | Commodity Revenue/Ton ($) | Net Cost/Ton ($) | CO2e Savings/Ton (mt) |
|---|---|---|---|---|---|
| OCC | [Fill] | [Fill] | [Fill] | [Calc] | [Fill] |
| PET | [Fill] | [Fill] | [Fill] | [Calc] | [Fill] |
Destination transparency and market risk
Demand destination clarity: domestic vs. export split, buyer confirmations, and historical stability of each end market. Monitor systemic risks—commodity price volatility, local acceptance list changes, and policy drivers like extended producer responsibility (EPR) and deposit return schemes (DRS). Inconsistent reporting remains a known challenge, so insist on documentation (see Reloop’s Global Recycling League Table).
Align packaging‑driven streams with realistic local processing using the How2Recycle categories (Widely Recyclable, Check Locally, Store Drop‑Off, Not Yet Recyclable) to calibrate expectations and education (see the How2Recycle guide to recyclability).
Pilot, monitor, and lock in performance clauses
Run a 90–180 day pilot to validate claims before scaling. Include data‑sharing requirements, contamination thresholds, corrective action timelines, and termination rights if KPIs are missed.
Mandate monthly reporting for recycling rate by material, yield, contamination, destination, cost/ton, on‑time pickup rate, and proof‑of‑service (tickets, images). Tie bonuses/penalties to verified thresholds—for example: contamination <10%, schedule adherence >98%, missed collection rate <1%.
Plan operations to reduce surprises
Operational discipline underpins cost control and high yields. Map each site’s container locations, access windows, and truck constraints. Align pickup frequency with generation profiles to prevent overflows and contamination.
Publish clear acceptance lists, add consistent signage and color‑coding, and train staff. Track on‑time pickup rate, schedule adherence, missed collection rate, and proof‑of‑service images to catch issues early.
Right-size roll-off containers
Match capacity to stream density and site access to avoid emergency pulls and overage fees.
- 10‑yard: small remodels, light cleanouts
- 15‑yard: garage cleanouts or single‑room remodels; good balance of capacity and footprint
- 20‑yard: multi‑room projects or heavier debris where access allows
Right‑sizing prevents overflows, reduces contamination risk, and stabilizes haul frequency.
Avoid overage fees and schedule misses
Eliminate preventable charges by writing practical guardrails into work orders: weight caps, prohibited items, access requirements, gate codes, and lift clearances. Set contamination thresholds with feedback loops and refresher training.
Build schedule buffers for peak days. Monitor fill levels and adjust frequency to prevent overflows that trigger surcharges and downgraded bales.
Use AI routing to improve on-time pickups
Routing optimization sequences stops by time windows, traffic, and service duration to lift schedule adherence and reduce missed collections. Require route adherence metrics and proof‑of‑service, and set alerts for exceptions so you can recover quickly.
Track pickup variance by site, adjust route density and frequency, and aim for >98% on‑time. Recycler Routing Guide centers route adherence and proof‑of‑service in this approach.
Portfolio strategy considerations
For multi‑site operators, network design often moves the needle more than any single contract. Compare hub‑and‑spoke consolidation versus on‑site compaction using a decision matrix: volume concentration, space, material mix, capex/opex, and route density.
Standardize KPIs portfolio‑wide—recycling rate by material, contamination, on‑time pickup, and cost/ton—for apples‑to‑apples roll‑ups, using a Recycler Routing Guide template to keep definitions and calculations consistent. Pilot at representative sites using the same data‑sharing and audit requirements.
Hub-and-spoke consolidation
Centralize high‑volume recyclables (like OCC) from multiple sites to a hub for baling and densification. Use optimized shuttles to the hub and track yield and revenue uplift against direct‑haul baselines.
Manage risks: commodity exposure, hub capacity constraints, and overflow contingencies during peak periods.
On-site compaction and space constraints
Deploy compactors for dense streams with predictable generation to reduce hauls and support cleaner material. Where space is tight, use smaller containers with more frequent collections, strict labeling, and access planning to avoid misses and overages.
Estimate capex payback using reduced pulls, improved yields, and avoided fees, and lock in maintenance SLAs.
Route density and volume concentration
Cluster service days and align vendors by geography to increase route density, lowering cost and variability. Rebalance containers and frequencies quarterly to hit steady fill targets and reduce emergency pulls. Track missed collection rate and schedule adherence by route; refine sequencing to maintain >98% on‑time.
Frequently asked questions
What is a commercial recycling rate and how should it be calculated?
It’s the share of your total waste that gets recycled, calculated as (recycled tons ÷ total waste tons) × 100 over a 12‑month window with a documented material scope. Recycler Routing Guide uses this standard for apples‑to‑apples comparisons.
Which costs should I compare beyond the headline recycling percentage?
Compare cost/ton for recycling vs. landfill, transport frequency, contamination fees, and commodity revenue; require net cost reporting after rebates. Recycler Routing Guide templates emphasize net cost alongside operational KPIs.
How can I verify provider claims without a full third-party audit?
Request weighbridge tickets, MRF yield/contamination reports, and destination receipts, then spot‑check a few loads and require monthly digital proof‑of‑service. Recycler Routing Guide checklists keep documentation consistent.
How do container size and pickup frequency affect my recycling rate and costs?
Right‑sized containers and calibrated pickups prevent overflows and contamination, protecting yields and avoiding surcharges; a 15‑yard roll‑off often balances capacity with access for typical cleanouts. Recycler Routing Guide applies this rule of thumb in planning.
When should I use curbside bulky pickup, roll-off dumpsters, or junk removal?
Use curbside bulky pickup for occasional items within municipal limits, roll‑offs for planned projects with steady debris, and junk removal for one‑time, labor‑intensive cleanouts. Recycler Routing Guide helps map the right option to your site constraints.
Citations:
- EPA National Recycling Goal: Recycling rate ~32%, 50% by 2030, methodology updates (https://www.epa.gov/circulareconomy/national-recycling-goal-recycling-rate-measurement)
- Reloop’s Global Recycling League Table: collection vs. true recycling gaps; DRS performance; reporting inconsistencies (https://www.reloopplatform.org/wp-content/uploads/2024/06/Global_Recycling_League_Table_Phase_1_Report.pdf)
- Beyond Plastics analysis: U.S. plastics recycling rate ~5%–6% (https://www.beyondplastics.org/publications/us-plastics-recycling-rate)
- Industry guidance on recycling success and benchmarks (https://www.okonrecycling.com/consumer-recycling-initiatives/learn-about-recycling/recycling-success/)
- The Recycling Partnership 2024 State of Recycling: capture losses and system diagnostics (https://recyclingpartnership.org/residential-recycling-report/)
- The Recycling Partnership data resources for local programs (https://recyclingpartnership.org/data/)
- Business waste statistics and energy savings context (https://fvrecycling.com/blog/surprising-statistics-about-the-waste-that-businesses-produce)
- How2Recycle guide to recyclability categories (https://greenblue.org/2024/01/04/the-how2recycle-guide-to-recyclability/)