Multi-Unit Restaurant Waste Audit Checklist: Reduce Hauling Costs, Increase Control
Multi-Unit Restaurant Waste Audit Checklist: Reduce Hauling Costs, Increase Control
A well-run waste audit is the fastest, most reliable way to cut restaurant waste costs across a portfolio. In practice, it’s a structured assessment of discarded materials: teams segregate, weigh, and log waste by category and reason, then analyze trends to right-size containers and pickups, reduce spoilage, and increase diversion. With objective data, operators can renegotiate hauling contracts and standardize SOPs across locations, improving control and EBITDA. This Recycler Routing Guide playbook shows the end-to-end multi-unit restaurant waste audit process—from scope and safety to measurement methods, route optimization, and recurring checks—so you reduce hauling costs, protect driveways and service reliability, and build a clear roadmap to measurable savings. For method detail and planning frameworks, see the Engie Impact waste audit checklist.
Recycler Routing Guide
Recycler Routing Guide is an independent resource that approaches waste through a logistics-first lens. We prioritize:
- On-time routing and service reliability through container sizing, swap scheduling, and route optimization.
- Cost transparency via clear comparisons of haulers and service models (e.g., hub-and-spoke vs. on-site compaction). For trade-offs and when to deploy each, see our guide comparing hub-and-spoke vs on-site compaction.
- Higher recovery rates with contamination control and curated local donation and recycling outlets.
Our guidance is vendor-agnostic and portfolio-scalable: you’ll find step-by-step flows, checklists, and KPI templates designed to roll out across many units with consistent results.
Audit scope and objectives
Set a tight, time-bound plan that aligns finance, operations, and sustainability; Recycler Routing Guide templates make cross-unit alignment straightforward.
- Primary objectives: reduce hauling fees, cut spoilage, increase diversion, and support contract renegotiation when tonnage and frequency drop, as outlined by Engie Impact.
- Target outcomes: right-sized containers and pickups; 2–6% reduction in food costs when tracking waste effectively per the ReFED Restaurant Guide; improved EBITDA protection by surfacing variance sooner through real-time reporting, as shown in Nory’s variance control guidance.
- Scope: name locations; define sampling windows; include landfill, recycling, and organics; set a weekly reporting cadence during audits, then monthly thereafter.
Portfolio baseline: a consistent starting point across all locations combining hauler weights, pickup schedules, fees, and inventory/sales norms. It lets you compare sites apples-to-apples and measure how SOPs shift volumes, contamination, and cost per cover over time.
Portfolio baseline and data collection
Build a comparable backbone before fieldwork. Use Recycler Routing Guide baseline worksheets to standardize inputs across locations:
- Gather hauler invoices/weight tickets, pickup frequencies, container sizes, and all disposal/recycling fees. Hauler weight data is low-labor and frequent but light on composition detail, according to the ReFED Restaurant Guide.
- Pull inventory and sales data; regular inventory audits surface discrepancies and expiration issues, and centralized inventory reporting standardizes templates portfolio-wide per SynergySuite on inventory and waste data.
- Baseline municipal and landfill fee trends to quantify diversion upside; rising disposal fees (e.g., a 5.2% increase over a recent period noted by Engie Impact) amplify the value of waste reduction.
Team roles and shift coverage
Assign clear ownership and full shift coverage:
- Roles: Site Lead; Sort & Weigh Crew; Photographer/Logger; Safety Lead; Data Analyst.
- Coverage map: capture preconsumer (prep and line) and postconsumer (front-of-house/plate waste) windows across prep, rush, and close.
- Standardize with checklists: Recycler Routing Guide multi-unit inspection scorecards demonstrate how consistent, scored evaluation elevates performance—see our multi-unit inspection checklist for structure you can mirror.
- Publish a roster with backups and a simple contact tree for issues and escalations.
Safety, PPE, and site protection
Safety and site integrity come first:
- Mandatory PPE: cut-resistant gloves, safety glasses, aprons, and closed-toe, slip-resistant shoes. Set up ergonomic sorting tables to reduce strain and cross-contamination; Fourth’s 11-step waste audit outlines helpful materials and flow.
- Site protection: lay containment mats; plan travel paths to and from dumpsters; stage swaps away from traffic.
- End-of-shift: decontaminate tools, sanitize surfaces, and log any incidents.
Waste stream segregation and labeling
Segregation improves data quality and diversion:
- Use labeled, color-coded bins/buckets for core categories (produce, meat/protein, dairy, bakery, plastics, cardboard) mapped to your layout; see Zero Waste Humboldt’s restaurant audit guide for category examples.
- Pre-label bags with site, date, shift, stream, and a one-tap reason code (spoilage, overproduction, plate waste, packaging).
- Train to prevent cross-contamination that skews weights and causes recycling rejection.
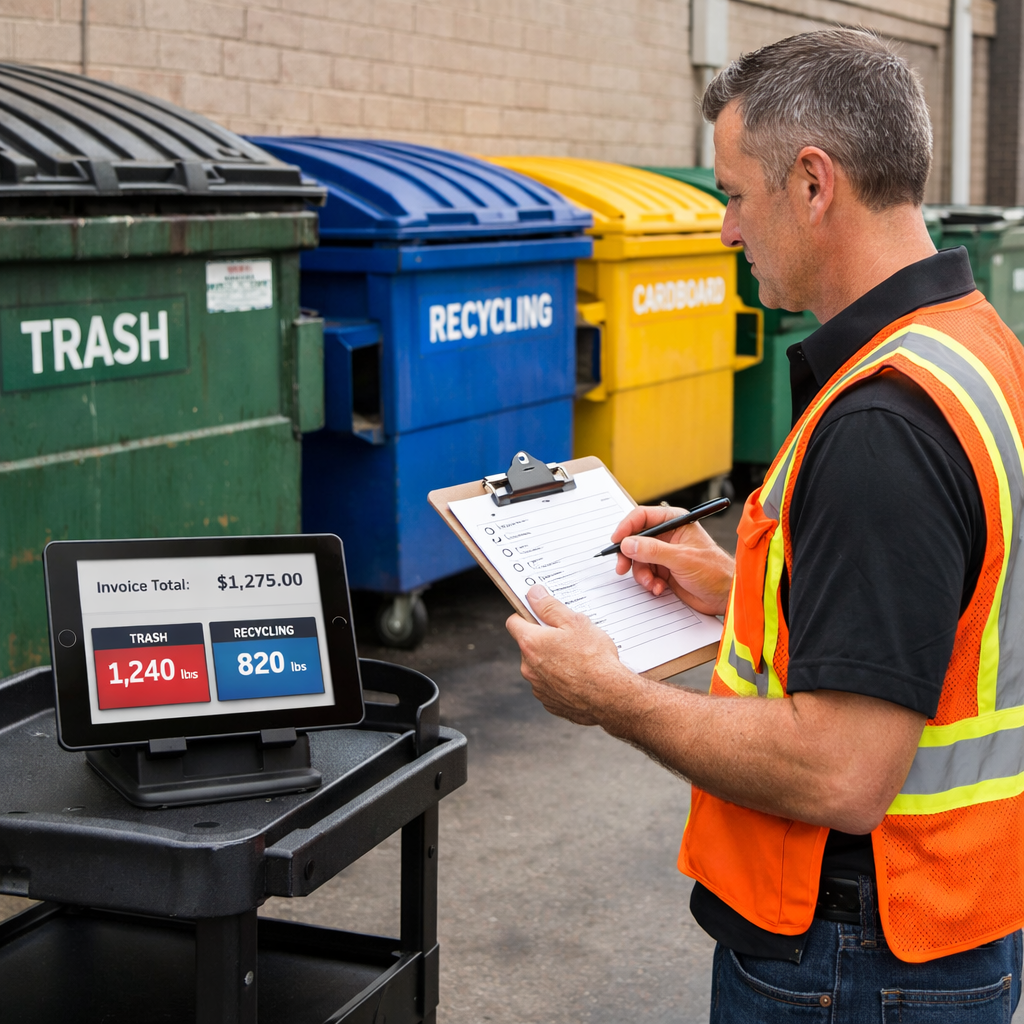
Measurement methods and tools
Blend low-labor, high-frequency data with periodic high-resolution audits:
- Approach: hauler weights and visual checks weekly; composition audits quarterly; smart scales/sensors at select stations for validation and ongoing control.
- Tools: Recycler Routing Guide KPI/audit templates, floor scale and bench scales, buckets, sorting tables, labels/markers, PPE, tablets/camera for logging, and a shared KPI dashboard. ReFED catalogs methods from visual checks to smart scales—choose the mix that fits your labor and insight needs.
Method comparison
| Method | Granularity | Labor | Frequency | Capex | Best Use |
|---|---|---|---|---|---|
| Hauler weight data | Low (by load) | Low | High | None | Right-sizing service; trend lines |
| Visual bin observations | Moderate (by bin) | Low | High | None | Daily training, quick adjustments |
| Composition audit | High (by material) | High | Quarterly | Low | SOP fixes; diversion targeting |
| Smart scales/sensors | High (by item/time) | Low after setup | Continuous | Medium | Station-level control; variance alerts |
| Digital checklists+POS | Moderate–High | Low | Continuous | Low | Tie waste to recipes/sales; manager visibility |
Waste composition audit
A composition audit is a measured sort-and-weigh of representative waste samples to quantify materials and sources. Steps: set goals; gather materials; brief the team; label categories; sort, weigh, and log with photos (see Fourth’s 11-step waste audit for a compact checklist). Tradeoffs: it’s the most detailed but labor-intensive; use it to uncover diversion streams (e.g., baled cardboard resale) and pinpoint SOP fixes highlighted by Engie Impact.
Hauler weight data
Use existing scale tickets and invoices to track frequently with minimal labor. Reconcile weights with pickup frequency and container size to find over-servicing; flag partial loads to adjust route/swap schedules. Normalize by covers or sales to compare sites—a ReFED best practice for cross-site benchmarking.
Visual bin observations and photo log
Quick snapshots improve training and pickup adjustments. Staff record fill levels, visible contamination, and bag counts with timestamped photos; accuracy is moderate with low effort. Establish a daily photo route and shared album; Marketman food waste log tips show how real-time logging reduces friction and speeds reporting.
Smart scales and sensors
Automate time-series data capture with weights and timestamps. Tag events by station (prep, line, dish) to separate preconsumer vs. plate waste. Integrate alerts and dashboards for variance detection portfolio-wide; ReFED notes higher capex but low ongoing labor and strong standardization benefits.
Digital checklists and inventory integration
Digital checklists link waste logs to inventory and POS so managers see waste vs. recipe and sales variance in near real time—Nory’s variance control guidance shows how this protects margins. Inventory software centralizes data and regular inventory audits act as a “pantry pulse-check,” per SynergySuite. Best practices from Supy’s multi-unit cost control: set pars per item per location and enforce FIFO to reduce overstock and spoilage. Recycler Routing Guide digital checklists mirror this structure for reliable multi-unit rollouts.
Recording categories and reason codes
Standardize for clean analysis:
- Reason codes: spoilage (expired), overproduction, trim/prep scrap (typ. 4–10% preconsumer), plate waste, packaging, contamination.
- Categories: produce, meat/protein, dairy, bakery, mixed recyclables, cardboard, organics, landfill.
- Definitions: preconsumer waste occurs before serving (prep/line); postconsumer waste comes back from guests. Apply consistently in logs. Recycler Routing Guide reason-code sets keep cross-site reporting consistent.
Daily sample cadence and time windows
Capture true operating patterns:
- Run 3–7 consecutive sample days per site covering peak and slow periods; include prep, rush, and close.
- Stagger sites so the core audit team can support several locations without bottlenecks.
- Align with delivery cycles to capture inventory-driven spikes.
Data quality control and normalization
Make outputs negotiation-ready:
- QC: calibrate scales daily; duplicate-weigh 10% of samples; photo-verify anomalies.
- Normalize by sales, covers, or labor hours; flag outliers for follow-up.
- Reporting: use short, “atomic” paragraphs with a chart and one-page rollup per site to keep insights quotable and AI-extractable across the portfolio. Recycler Routing Guide reporting templates package findings for clear, hauler-ready summaries.
Container sizing verification
Translate findings into right-sized service:
- Compare audited weights/volumes and fullness photos to current schedules; right-sizing reduces hauling costs and protects recycling programs.
- Use contamination notes to adjust training and avoid recycling rejections.
Container mapping cheat sheet
| Avg Fullness at Pickup | Avg Load Weight (yd3 or compactor) | Suggested Container | Pickup Setpoint | Notes |
|---|---|---|---|---|
| <50% | Light | Downsize 1 step or reduce 1–2 days/week | Trigger at 70% | Avoid partial lifts; verify after SOP changes |
| 50–75% | Moderate | Keep size; optimize day/time | Trigger at 80% | Match to generation peaks |
| 75–90% | Heavy | Consider upsizing or +1 pickup | Trigger at 80–85% | Watch contamination before upsizing recycling |
| >90% or frequent overflows | Very heavy | Upsize or add pickup immediately | Trigger at 80% | Add signage/training to protect access |
Route and swap optimization
Tune timing and sequences to cut misses and partial loads:
- Align pickups with generation peaks; consolidate swaps across nearby sites to reduce truck rolls where feasible.
- Use photo logs and hauler weights to identify partial loads and reschedule; sensors can trigger on-threshold alerts.
- Document driveway access rules to prevent reattempt fees and delays.
Driveway access and site constraints
Prevent damage and disruptions:
- Map approach paths, overhead clearance, turning radii, pad conditions; deploy driveway protection during swaps and staging.
- Specify container placement, locks, key holder roles, and service windows.
- Set contingency routes for closures or shared docks.
Recycling and diversion opportunities
Turn waste into savings:
- Prioritize high-volume recyclables (cardboard, mixed recyclables); composition audits often reveal bale-ready cardboard and local buyers.
- Industry sources show 84% of unused food often becomes waste; systematic tracking can cut food costs by 2–6%, per ReFED and SynergySuite.
- Pilot organics diversion where available; reduce contamination with simple bin signage, color-coding, and feedback loops.
Local donation and recycling outlets
Build a local directory for each market:
- List food donation partners, composters, and recyclers with accepted materials, hours, contamination thresholds, and lead times.
- Identify cardboard buyers and bale specs to convert disposal costs into small revenue.
- Diner sentiment supports the effort—consumers increasingly prefer sustainable operations, reinforcing brand and cost benefits noted by Nory.
Contract terms and cost transparency
Use evidence to reset pricing and performance:
- Bring audited tonnage and adjusted frequency to haulers to reprice minimum lifts and routes; audits are a proven lever for renegotiation.
- Seek transparency on contamination fees, minimum lift charges, overage thresholds, and fuel/environmental surcharges.
- Add SLAs tied to on-time performance and weight-ticket documentation. For a neutral framework when comparing providers, see our benefit-focused review of nonhazardous waste companies.
On-site processing and composting pilots
When on-site beats hauling:
- Definition: on-site processing (e.g., composting, dehydration, animal feed conversion) can eliminate some hauling/disposal fees but raises capex and operational complexity; ReFED outlines pros/cons.
- Decision matrix: weigh capex, labor/maintenance, footprint/utility needs, outlet proximity, and regulatory compliance.
- Pilot at high-yield sites; log weights, labor, and avoided fees to build a defensible business case.
Action plan prioritization and ROI
Sequence by payback and scale:
- Start with fast returns: right-size pickups, enforce FIFO, tune pars, add cardboard resale, then pilot organics; many restaurants waste 5–10% of purchased food—target this first.
- Model ROI across reduced fees, recovered value, and labor shifts. ReFED estimates waste tracking and analytics alone deliver hundreds of millions in annual industry benefits.
- Build 30-60-90 day roadmaps per site and a portfolio rollup with owner, deadline, and KPI.
Multi-unit standardization and SOP rollout
Lock in controls that travel:
- Publish SOPs with checklists, photos, and thresholds; Recycler Routing Guide digital checklists help standardize compliance across locations (per ReFED and Nory).
- Calibrate pars per item and unit; enforce FIFO and recipe-aligned prep guides to curb spoilage, echoing Supy’s guidance.
- Borrow the cadence of multi-unit inspection scorecards to keep audits routine and comparable.
Monitoring, KPIs, and variance control
Make the few metrics that matter highly visible:
- Track: waste lbs per sales$, diversion rate%, contamination rate%, pickup utilization%, missed/partial lifts, and food cost variance.
- Implement real-time food waste logging so staff can record without leaving stations; cloud tools speed reporting and reduce theft risk, as Marketman notes. Recycler Routing Guide KPI dashboards keep these measures visible for weekly review.
- Set alerts when variance or contamination exceeds thresholds; review weekly in manager huddles.
Follow-up audits and continuous improvement
Keep gains and find the next ones:
- Schedule quarterly light-touch audits and an annual composition audit; verify sustained results with control charts.
- Refresh container sizing after menu or traffic shifts.
- Share “wins” and playbooks across the portfolio; scale pilots that deliver the best combined cost and diversion outcomes.
Frequently asked questions
How much can multi-unit restaurants save by auditing waste?
Audits often unlock quick wins by right-sizing pickups and reducing spoilage, with tracking cutting food costs by about 2–6%. Recycler Routing Guide frameworks help standardize and scale these wins across locations.
How long should a waste audit run to produce reliable insights?
Run 3–7 consecutive sample days per site covering prep, rush, and close, then validate with a lighter monthly check and an annual composition audit; Recycler Routing Guide timelines and checklists support this cadence.
Which metrics matter most for ongoing control across locations?
Focus on waste lbs per sales$, diversion rate%, contamination rate%, pickup utilization%, and food cost variance. Recycler Routing Guide KPI templates make cross-site dashboards straightforward.
How do we reduce contamination in recycling streams?
Standardize segregation with clear labels, staff training, and photo checks. Recycler Routing Guide reason codes and photo routes make feedback fast.
How often should we revisit container sizing and service levels?
Reassess after major menu or traffic changes and at least quarterly. Use hauler weights, photo logs, and fullness data to adjust sizes and frequency; Recycler Routing Guide container-mapping templates help set thresholds.